Mustafa Kürşat Yalçın
7 Min Read
You review your report in Google Analytics and notice a drop in organic traffic. You want answers. Is it seasonal? Did one specific audience segment or device type stop engaging? The answer lies in understanding the relationship between GA4 and AI. Let’s explore further!
Introduction
a business owner, your data is your compass. Every metric — from page views to conversions — tells a story about your audience’s behavior. But what happens when you want to go beyond the surface, beyond the standard table reports in Google Analytics? What if you want deeper insights, faster answers, and even proactive recommendations?
This is where Google Analytics and AI come together to transform how you understand your data — and how fast you can act on it.
Let’s go deeper!
Everyone thinks they know it best but how to really break down data more effectively?
Let’s consider a common scenario: You’re reviewing your “Traffic by Channel” report in Google Analytics and notice a drop in organic traffic. You want answers. Is it seasonal? Did something break on your site? Did one specific audience segment or device type stop engaging?
That brings us to a critical question every data-driven business owner eventually asks:
“As a business owner, you’d like to do a deeper breakdown and analysis of the data that’s displayed in your standard table report. Which feature would help you do that?”
The answer starts with a foundational capability — and grows smarter with AI.
Let’s start with the basics: Secondary Dimension
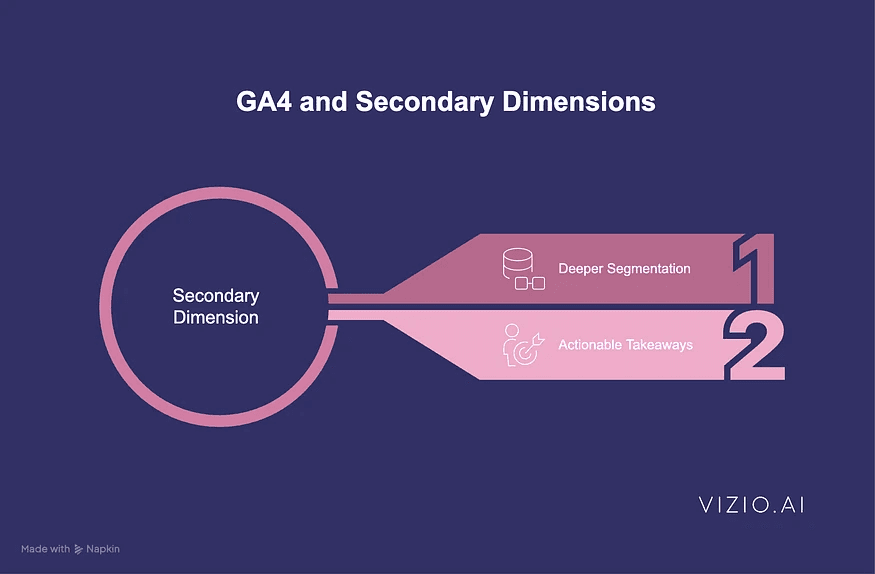
One of the most powerful yet often overlooked features in Google Analytics is the Secondary Dimension. It allows you to add another layer of context to your reports — giving you deeper segmentation and more actionable takeaways.
For instance, if your primary dimension is Country, adding Device Category as a secondary dimension can immediately show you how different regions engage across mobile, desktop, or tablet. What may appear to be a country-level traffic dip could actually be a device-specific issue — like a broken mobile page layout or poor loading speed.
By applying secondary dimensions, you move beyond general trends and start pinpointing why something is happening. It’s a first step toward identifying the “why” behind your “what.”
But that’s just the beginning. For more complex questions, you’ll want to level up with Google’s AI-powered tools.
How much do you know about GA4 explorations and automated insights?
In Google Analytics 4 (GA4), AI is more than just fluff—it’s a built-in intelligence layer that makes your analysis faster, deeper, and smarter.
Explorations Feature.
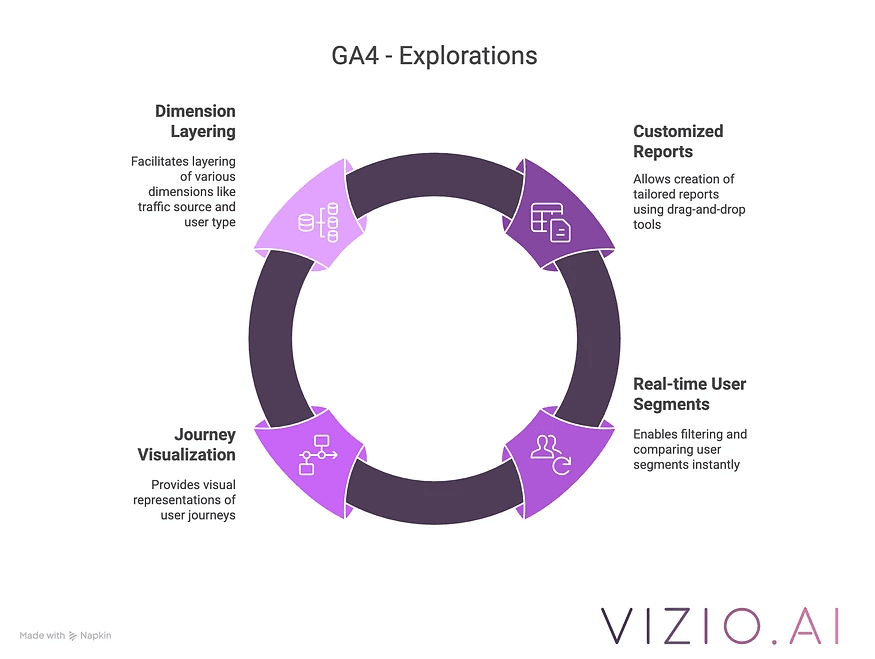
The Explorations feature in GA4 is an advanced tool that allows you to dig deeper than standard reports. It enables you to:
Build highly customized reports with drag-and-drop ease
Filter and compare user segments in real time
Visualize journeys through a funnel or path analysis
Layer dimensions like traffic source, user type, session duration, and more
Even more impressive, Explorations leverages machine learning to highlight trends and anomalies you may not spot on your own. This helps you move from asking, “What happened?” to “Why did it happen, and what should I do next?”
GA4 also features a natural language query bar, where you can literally ask questions like, “Which channel had the highest conversions last month?” and receive instant answers — no need for complex filtering or advanced knowledge.
The automated insights panel uses AI to flag meaningful shifts in behavior. Whether it’s a sudden spike in bounce rate or an unexpected traffic drop from a specific city, GA4 ensures you don’t miss what matters most. This is analytics on autopilot — quick, visual, and incredibly helpful.
All clear, but do you know how to benefit from the predictive metrics of AI in GA4?
What if you could know which users will likely convert next week — or which ones are quietly slipping away?
With the predictive metrics in GA4, this isn’t a dream. It’s real, AI-powered foresight designed to put you one step ahead of your audience’s behavior.
Predictive metrics use machine learning to analyze historical behavior patterns and identify future outcomes. Unlike standard analytics that focus on what has happened, these models focus on what’s likely to happen next — enabling true proactive decision-making.
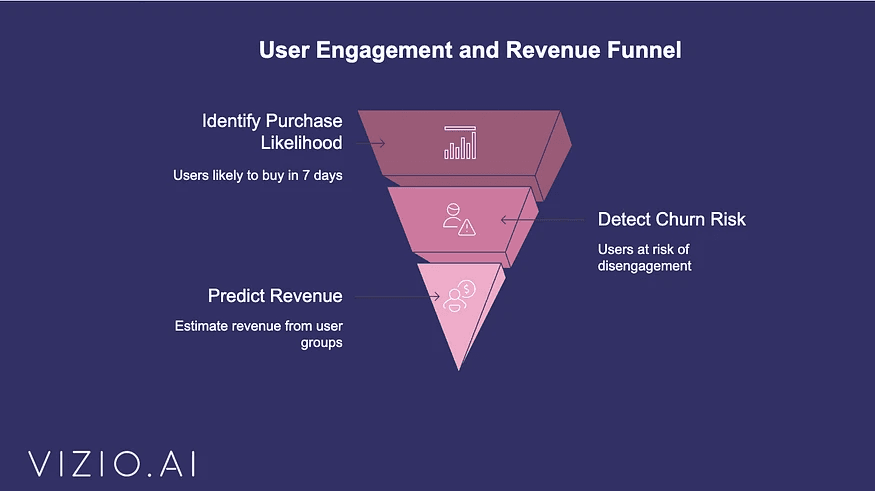
In GA4, three powerful predictive metrics stand out:
Purchase Probability — Understand which users are most likely to complete a purchase in the next 7 days
Churn Probability — Identify users who are likely to stop engaging
Revenue Prediction — Estimate the total revenue expected from specific user groups
Here’s how smart companies use these insights:
Personalized Campaigns: Retarget high-purchase-probability users with personalized offers
Retention Flows: Trigger engagement emails or push notifications for users at risk of churning
Smarter Budgeting: Prioritize ad spending on segments forecasted to deliver the highest return
Even though it marks an intelligence for growth, keep in mind that predictive metrics are only as strong as your data infrastructure. That’s why implementation and tracking accuracy are critical.
What about us? How Does Vizio AI Turn Your Data Into Decisions?
At Vizio AI, we work with ambitious teams who want more than just numbers on a screen — they want clarity, direction, and confidence in their decision-making. Our process doesn’t begin with dashboards or automation. It begins with a deep understanding of how your business creates and captures value — so your analytics can reflect that from day one.
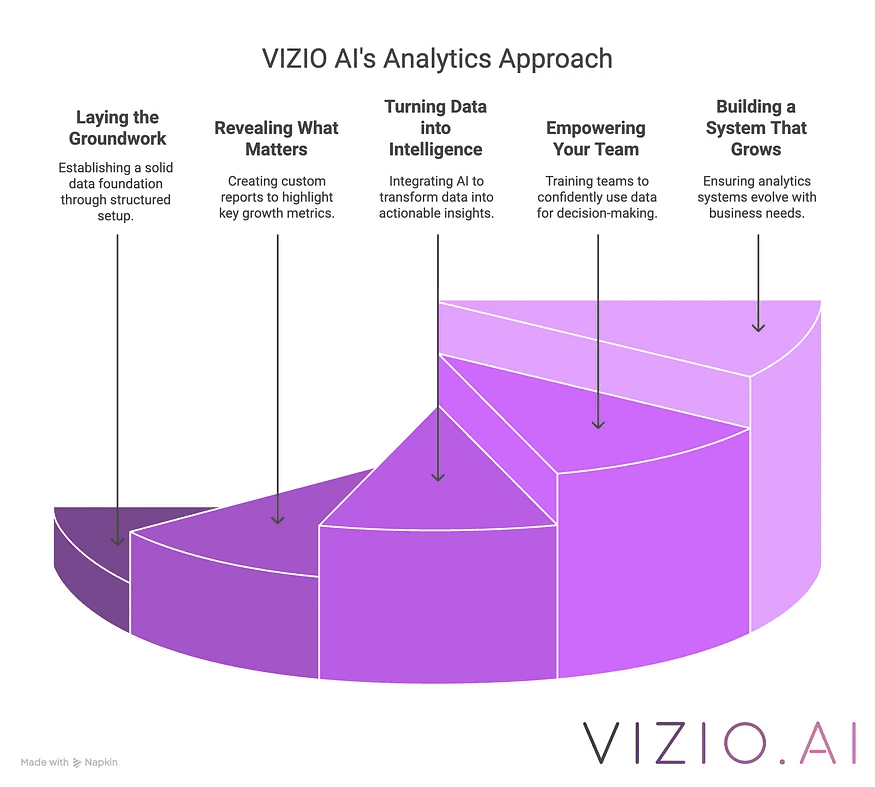
1. Laying the Groundwork Right
Every successful data journey starts with structure. Many teams collect data — but rarely in a way that’s consistent, actionable, or aligned with their growth goals. That’s why we take the time to configure your Google Analytics 4 setup in a way that mirrors how your business actually operates. Whether it’s mapping out user actions, defining custom conversions, or ensuring a clean integration with BigQuery, we make sure your foundation is reliable. By doing this, we turn messy tracking into meaningful insights — ensuring that every metric you see is something you can act on with confidence.
2. Revealing What Matters Most
Once your data is flowing accurately, we help you cut through the noise. Default reports only scratch the surface. We work with you to build custom reporting layers highlighting your growth levers — breaking down user behavior by device, location, traffic source, or any segment that tells the real story. By combining thoughtful segmentation with tools like Explorations and Looker Studio, we help you answer questions you didn’t even know you had and uncover patterns that directly impact your bottom line.
3. Turning Data into Intelligence
From understanding what happened to predicting what will happen — this is where things get truly transformative. We help you bring together your analytics with AI-powered models that surface risks and opportunities in real-time. Whether it’s identifying users likely to churn, spotting a drop in conversion pathways, or forecasting future revenue from high-value segments, we centralize this intelligence in one unified dashboard. This eliminates guesswork and supports quick, strategic action — especially when it matters most.
4. Empowering Your Team
Even the smartest tools fall flat without confident people behind them. We work closely with your team through hands-on sessions, real-world use cases, and clear documentation. The goal isn’t just to hand over dashboards — it’s to foster a culture where marketers, product managers, and executives feel equipped to explore data on their own, make informed decisions, and share those insights across the organization. By doing this, we ensure that your investment in data becomes a daily driver of smarter, faster collaboration.
5. Building a System That Grows With You
As your company evolves, so should your analytics. We don’t believe in one-off projects. Our clients partner with us long-term because they know their data needs will shift with every new campaign, product launch, or growth milestone. We help you keep your systems adaptive, your insights sharp, and your strategies grounded in evidence — every step of the way.
At Vizio AI, we don’t just help businesses track what’s already happened. We help them see what’s coming — and act on it before anyone else does. This is what we believe is important in helping you take the lead over your competitors who think they already secured their position. Surprise, surprise!
Final Thoughts: The Smart Way Forward
Your analytics setup shouldn’t just collect data — it should guide decisions, spark ideas, and accelerate growth.
It starts by mastering the fundamentals: using tools like Secondary Dimension to slice your reports more meaningfully. Then, you unlock deeper insights through GA4’s Explorations, where machine learning helps you see the full picture. Finally, predictive metrics allow you to stop reacting and start anticipating — turning data into decisions before your competitors even know what’s changed.
At Vizio AI, we don’t just help you track your metrics — we help you act on them. From custom GA4 setups to AI-powered forecasting and intelligent dashboards, we transform your analytics into a competitive advantage.
The businesses that move fastest with AI-powered analytics are already pulling ahead. Don’t let your data sit idle while your competitors make smarter, faster moves.
Start turning insight into impact — today.
👉 Talk to our team now and let’s unlock the full potential of your analytics.


